Technology can be the painkiller for your CSRD reporting headache
28.10.2024 – Sustainability professionals: don't miss this prime opportunity! Use the reporting requirements as your mandate to build your sustainability dashboards and monitoring systems to a state that will benefit you in the years to come.

The new EU legislation makes sustainability data visible at the executive team level. Starting this year, large listed companies must report on their social and environmental impacts in accordance with CSRD in their annual reports. Next year, the obligation will extend to other large companies.
The good news is that most companies have sustainability issues in order. But the bad news is that proving it is going to be really challenging.
One option is to put their heads down and get it done with old fashioned hard work.
Information is needed from different areas such as energy and water consumption, waste production, or even the environmental impacts caused by the company’s supply chain. The responsibility falls on the sustainability reporting teams to decide how to handle all the reporting tasks now, in the first year of CSRD reporting.
One option is to put their heads down and get it done with old fashioned hard work. This option includes filling out excels workbooks and writing reports in Microsoft word.
However, as you can expect, most companies are aiming to find methods or technology to make this years reporting tasks more efficient – via a system that helps the future years too.
1. Understand the big picture

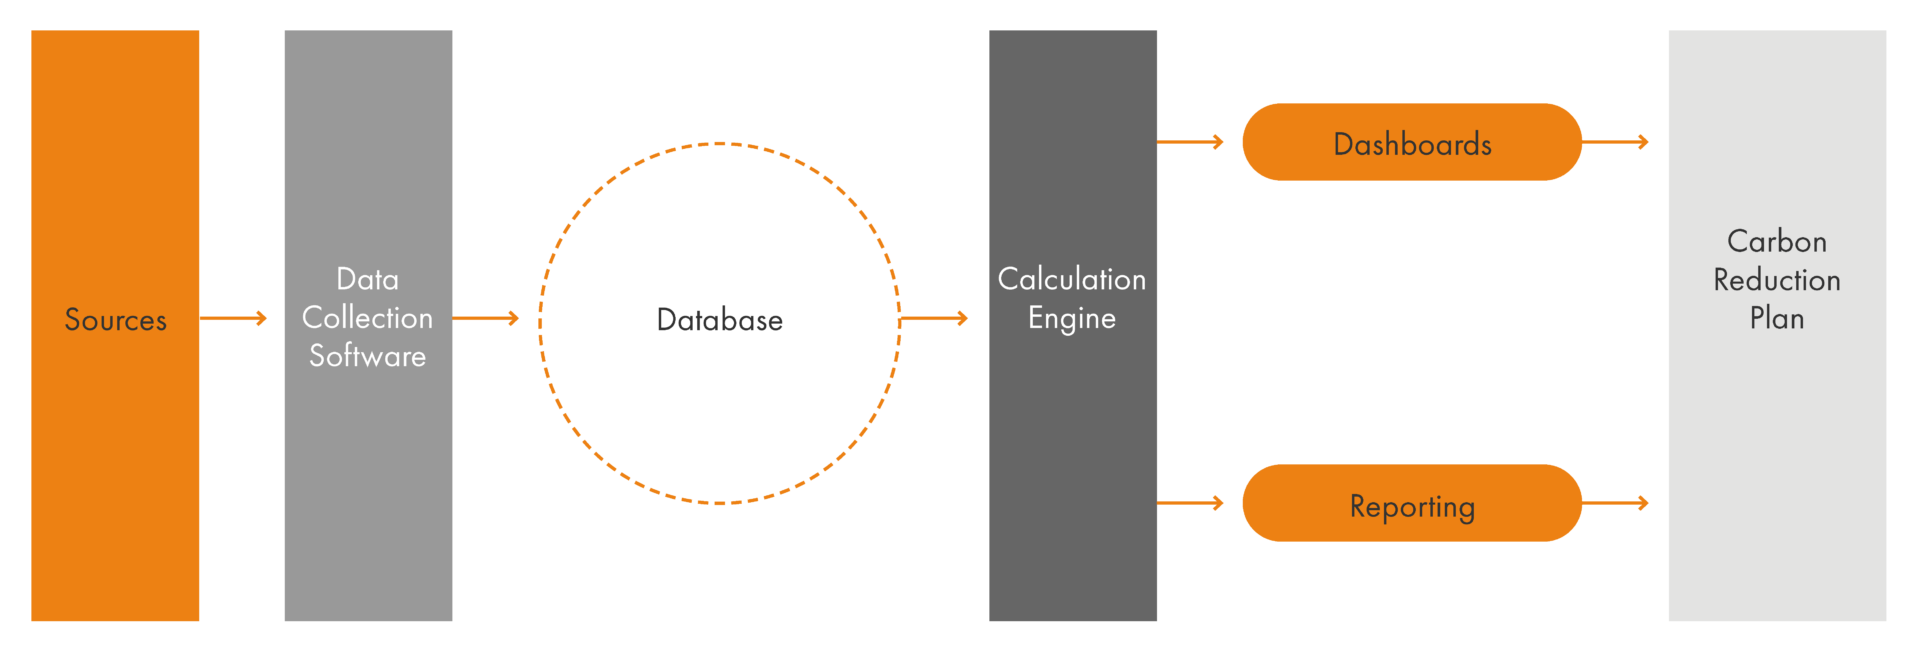
The best place to start with technology and sustainability reporting is to think of the whole thing as a data flow problem. Data comes in, data is stored, calculations are done on the data and the data is used in the final report.
If the data comes in, in the correct way then it is sitting in an easy to find place for the calculations. The output of the calculations also needs to be stored correctly so that they can be used in the reports and the dashboards.
See the image above for example.
Data comes in, data is stored, calculations are done on the data and the data is used in the final report.
The key step at this stage is to keep the long term plan in your mind and to prioritise some areas to improve with technology.
2. Prioritise
Once you have taken the time to understand the big picture then the next step is to admit that you cant do everything in the first year. The key step at this stage is to keep the long term plan in your mind and to prioritise some areas to improve with technology.
It could be a calculation flow for your energy consumption that takes data directly from your energy utility company for all of your sites and adds emissions factors to them.
It could be automatically collecting all of the key data points from your waste company. Once again, just pick a few areas to improve this year and move on to the details.
3. Decide how deep to go with technology
Even when you have prioritised the areas to improve with technology there are still difficult choices to make. For all areas there are short term, medium term and long term technological approaches.
Let’s take waste data that comes from your waste and recycling service providers for example. Key waste datapoints are for example:
- Amount of waste
- Outlay
- Logistics costs
- Recycling rate/amount of waste recycled
- LoW Code
- Waste category
- R/D Code
- Emissions
The long term approach would to build an API integration that takes data directly from their system into your database. Once it is there it will be available to flow into your dashboards and reports (once those parts are ready). This is assuming that the waste company has an API for you to connect to.
The medium term approach would be would to build a file upload software that allows you to upload data once a month from your supplier into your database.
The short term approach is to build an easy to use software input template that allows your team to manually input data such as the recycling rate at a specific time. This input form is significantly better than sending Excel files by email. When the information is found in the system, it is available to everyone.
4. Use the reporting requirements as a mandate to improve the visibility of your sustainability KPIs
While those working with CSRD are certainly very busy, I hope that the first year’s work will benefit everyone as much as possible. Sustainability directors should not miss this opportunity to build metrics to monitor their impact and increase visibility into their plans to reduce long-term impacts.
If you want to dive a little deeper into the topic, please download my recent report using the form below!
About the writer: Ken Dooley is the Chief Data Officer at Granlund and he has a doctorate in environmental sustainability and innovation from Aalto University.
In case you want to talk about the topic, please don’t hesitate to contact Ken:

Ken Dooley
Read more blogs
Subscribe to our newsletter
Be among the first to hear about the latest news and trends relating to Granlund and the real estate and construction sectors.


